
A Year-in-Review from the DexaFit Network
Most health interventions fail for a reason the wellness industry would prefer you not examine too closely: people have no idea whether anything is actually working.
You start a new diet. You feel different—maybe better, maybe worse. Three months later, you've either abandoned it or convinced yourself it's transformational. Either way, you're guessing. Navigating by the stars when GPS exists.
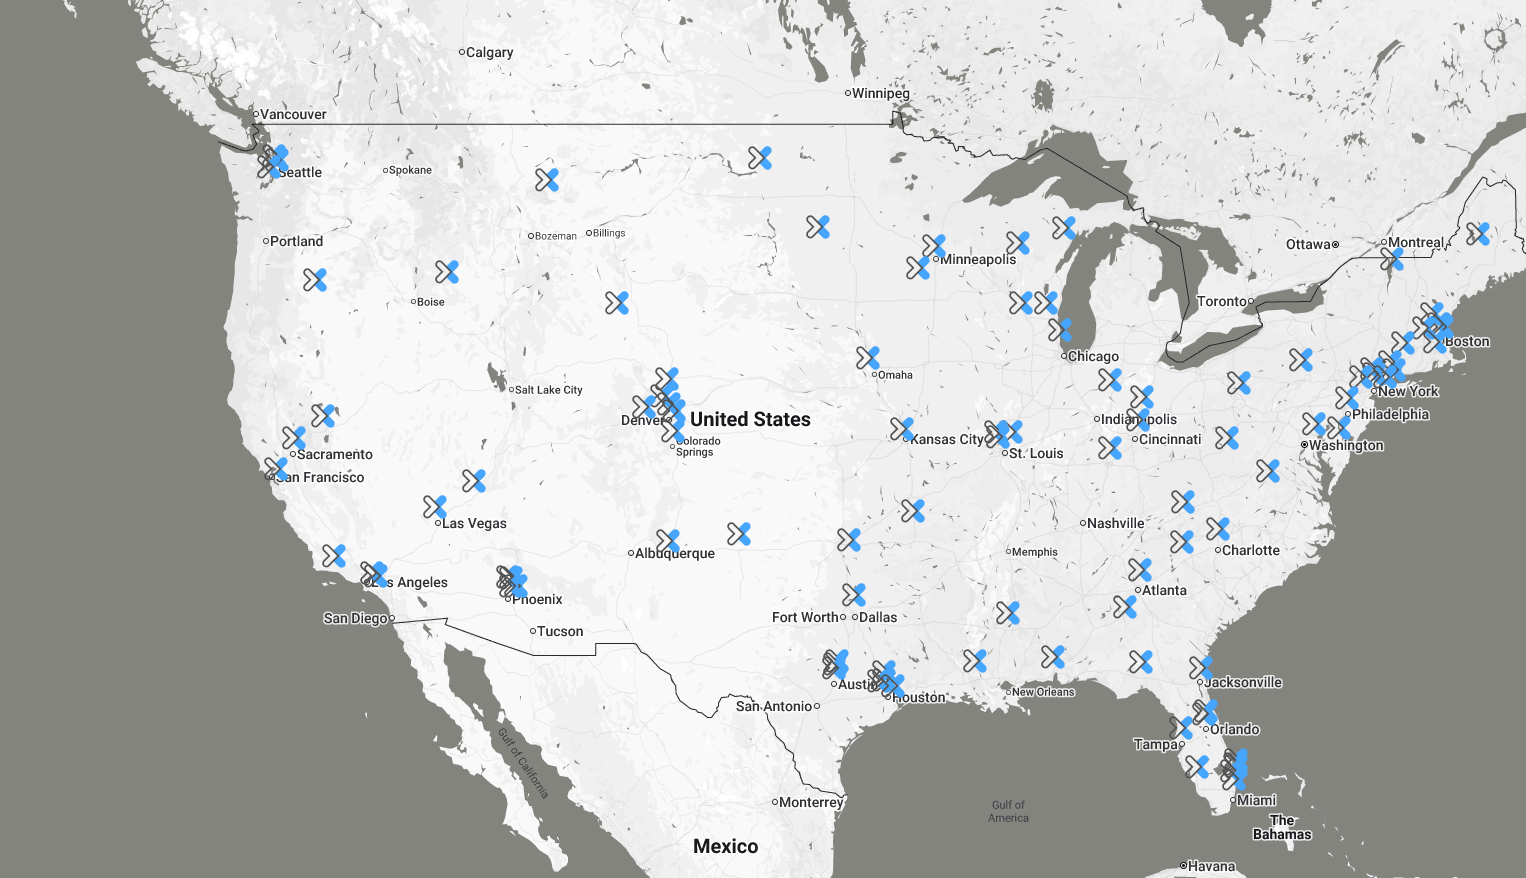
At DexaFit, we spent 2025 watching what happens when people stop guessing. Across our global network—locations throughout North America, Europe, Asia, and South Africa, with the majority in North America—we tracked real physiological changes in people who came back for follow-up testing. The data tells a story that should make you both optimistic and appropriately humble about what's possible when measurement replaces intuition.
The Direction of Change: A Network Summary
Before we examine each metric in depth, the headline findings deserve attention:
100% of locations showed average body fat reduction
100% of locations with VAT data showed average visceral fat reduction
96% of locations maintained lean mass
91% of locations maintained or improved bone mineral density
73% of locations with VO2 testing showed improvement
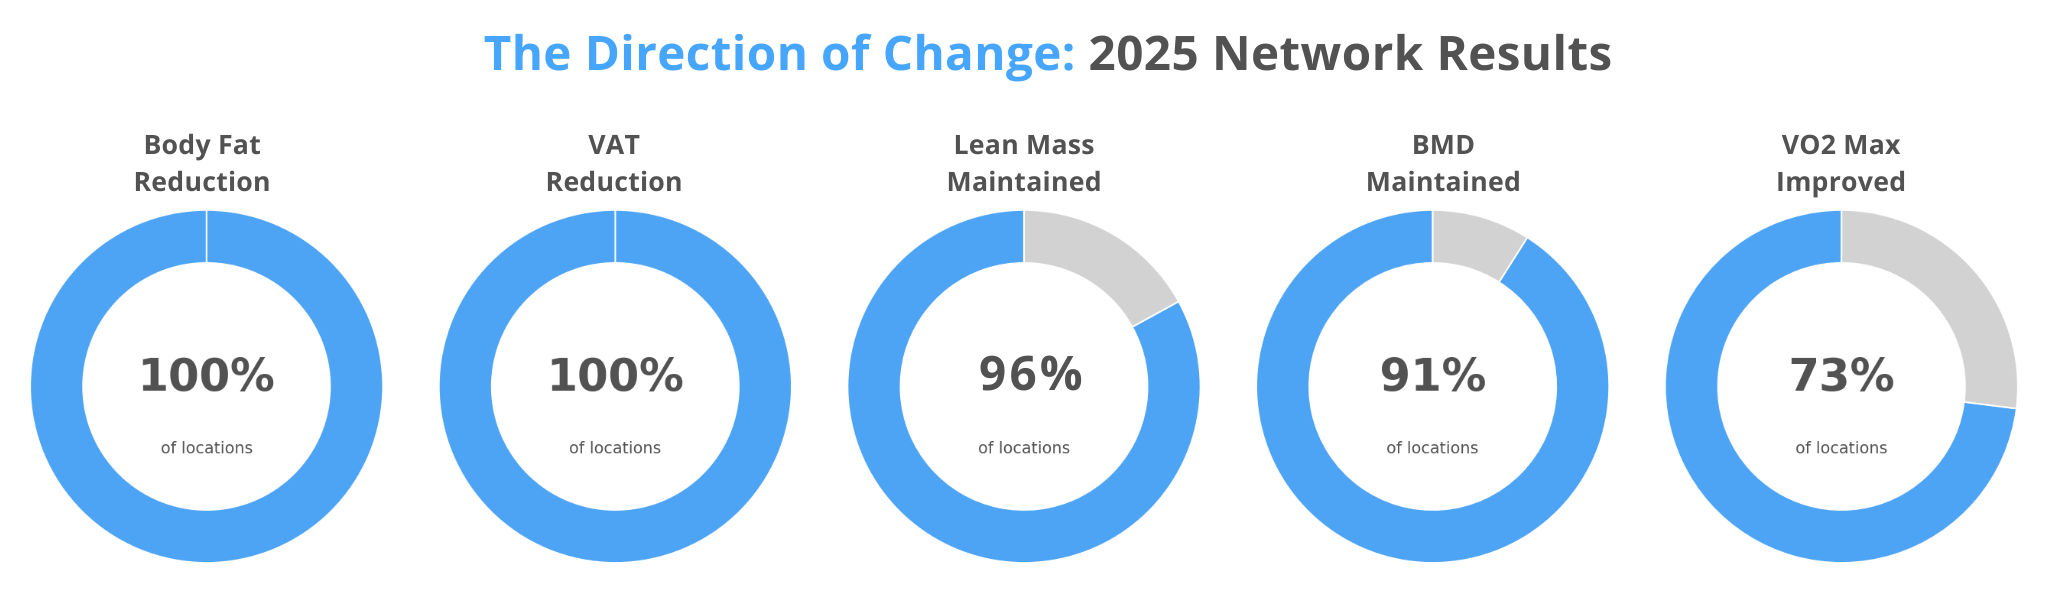
In a world where the default trajectory for adults is gradual weight gain of 1-2 pounds per year, with body fat percentage creeping upward as muscle mass simultaneously declines, this universal reversal is significant. The DexaFit population isn't drifting with the current. They're swimming upstream—every location, across four continents.
Body Fat Percentage: The Number Everyone Asks About First
Body fat percentage is invariably the first question people ask when they step off the DEXA table. It's the number on every fitness tracker, the metric every magazine cover promises to help you reduce, the thing people actually mean when they say they want to "lose weight."
As a starting point, it's useful. It gives people something concrete to track. For many, reducing body fat percentage correlates with improved metabolic health.
But its limitations deserve honest acknowledgment.
Body fat percentage can be misleading in isolation. Two people can walk into a DexaFit location with identical body fat percentages—say, 25%—and have radically different risk profiles. One carries most of that fat subcutaneously around hips and thighs, which is relatively benign. The other has it wrapped around liver and pancreas, which is actively pathogenic. Same percentage, completely different prognosis.
Context makes the network results more meaningful: the average American is moving in the opposite direction. NHANES data shows obesity prevalence in the US increased from 30.5% to 42.4% between 1999 and 2018, and that trend has largely continued [1]. The default trajectory for most adults is gradual weight gain—roughly 1-2 pounds per year through middle age, with body fat percentage creeping upward as muscle mass simultaneously declines.
Think of body fat percentage as the opening act. It's what gets people in the door. The deeper metrics are where the real story lives.
What the Distribution Shows - Body Fat Change by Percentile
The median client reduced body fat by 1.8 percentage points. Solid, sustainable progress. At the 75th percentile, we see reductions of 4 percentage points—the kind of change that visibly transforms how someone looks and feels. The 90th percentile shows nearly 7 points of reduction, which represents serious commitment over sustained effort.
Keep in mind: the DexaFit population is genuinely diverse. Some clients are already lean and maintaining—they're not going to move much. Others are managing chronic conditions that make fat loss physiologically difficult. Still others arrived with significant weight to lose and the metabolic runway to lose it. The distribution captures all of it.
🏆 Top Individual Performers – Body Fat Reduction
| Rank | Result | Location | Timeframe |
|---|---|---|---|
| #1 | −31.0 percentage points | DexaFit Jacksonville | 9–12 months |
| #2 | −23.4 percentage points | DexaFit Jacksonville | 6–9 months |
| #3 | −19.5 percentage points | DexaFit Long Island | 6–9 months |
These results sit well beyond the 99th percentile (-13.2 points). That first number deserves a pause. Someone walked in, got scanned, changed something fundamental about how they were living, and came back under a year later having dropped 31 percentage points of body fat. That's the difference between clinically obese and competition-lean. Jacksonville appears twice in the top three—something in the local coaching or culture is clearly working.
Results at this magnitude typically involve comprehensive intervention: structured nutrition protocols, intensive training programs, and in some cases medically supervised support. They represent what's possible when every variable aligns. The percentiles show what dedicated effort typically produces.
🥇 Top Location Rankings – Body Fat Reduction
| Rank | Location | Mean Change |
|---|---|---|
| 1 | Eminence Hormone and Weight Loss Center (Powered by DexaFit) | −6.93 percentage points |
| 2 | DexaFit Los Alamitos | −2.34 percentage points |
| 3 | DexaFit Vancouver | −1.85 percentage points |
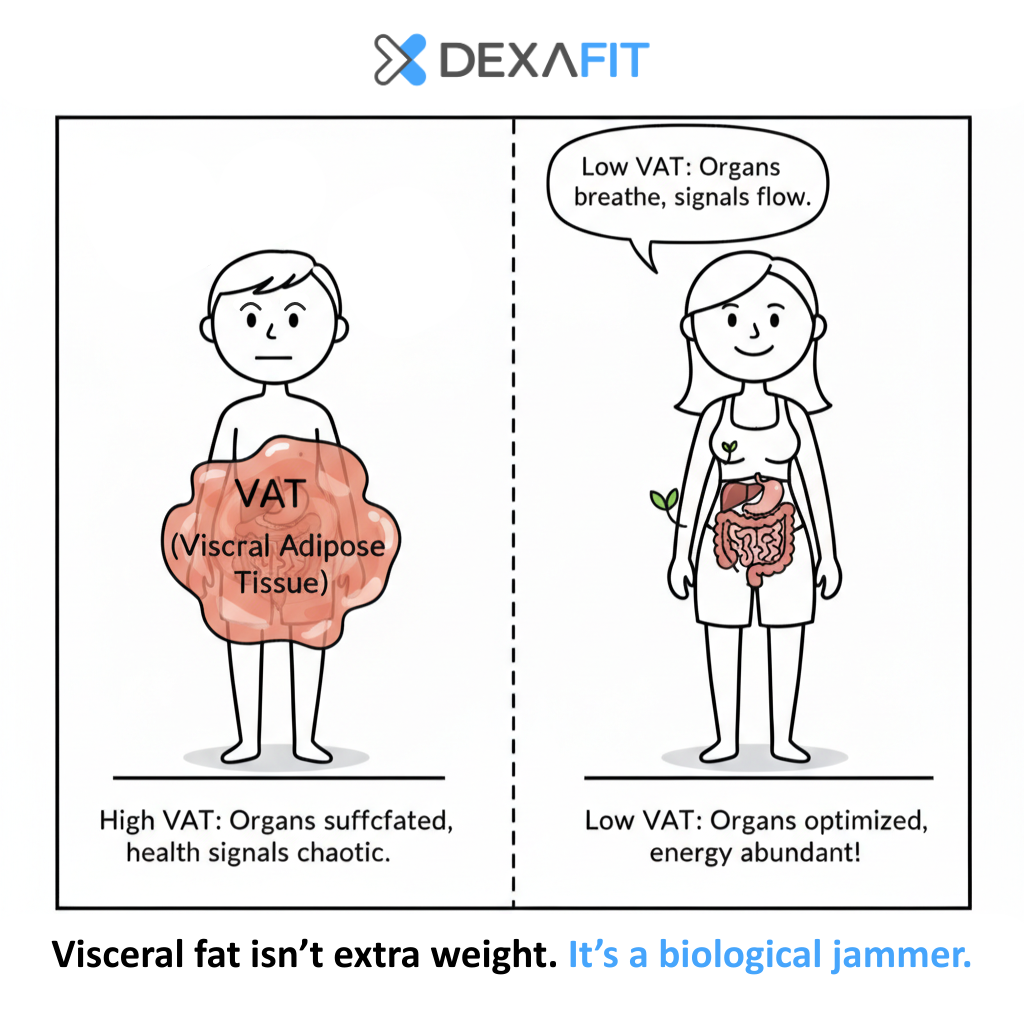
Visceral Adipose Tissue: The Fat That's Actively Trying to Kill You
Visceral adipose tissue—VAT—is the fat that accumulates inside your abdominal cavity, wrapping around liver, kidneys, intestines, and pancreas. It's metabolically distinct from the subcutaneous fat you can pinch between your fingers. The research on its health implications leaves no room for ambiguity.
A 2025 meta-analysis in Atherosclerosis analyzing 17 studies with over 824,000 participants found that high visceral adiposity was associated with a 55% increased risk of cardiovascular disease, a 45% increased risk of stroke, and a 38% increased risk of cardiovascular death. Each 0.5-unit increase in the visceral adiposity index was linked to a 14% increase in CVD risk and a 19% increase in cardiovascular mortality [2].
These aren't subtle correlations. These are effect sizes that should change behavior.
What makes visceral fat particularly dangerous is that unlike subcutaneous fat, which is relatively metabolically quiet, VAT is an active endocrine organ. It secretes inflammatory cytokines—tumor necrosis factor-alpha, interleukin-6, resistin—that promote systemic inflammation. It disrupts insulin signaling. It releases free fatty acids directly into the portal circulation, delivering them straight to your liver, promoting hepatic insulin resistance and dyslipidemia.
The insidious thing about visceral fat is that you can't see it. You can't feel it. Two people with identical waist circumferences can have wildly different VAT levels. One is metabolically healthy. The other is a ticking time bomb. Without imaging, you'd never know which one you are.
What the Distribution Shows - VAT Change by Percentile
![Fat vs Muscle Volume Comparison] Side-by-side photo or illustration: 1 lb of fat (small football-sized, yellow/pale) next to 1 lb of muscle (hockey puck-sized, red/dense). Caption: "Same weight. Different volume. Different health implications."](https://images.squarespace-cdn.com/content/v1/5489d598e4b0b95be7ccbe5a/dcda7058-fd51-439b-90d1-cfacd793ee9a/Montserrat-Heading-Medium+%282%29.png)
A visual helps here. Imagine holding a pound of fat in one hand and a pound of muscle in the other. A pound is a pound—no tricks. But the volume is completely different. That pound of fat is roughly the size of a small football. That pound of muscle? About the size of a dense hockey puck.
The median reduction of 0.15 lbs might sound modest until you picture it: a chunk of inflammatory tissue roughly the size of a golf ball, no longer wrapped around your liver, no longer suffocating your kidneys, no longer pumping inflammatory signals into your bloodstream. At the 90th percentile, clients eliminated over a pound—a small football's worth of organ-strangling tissue.
🏆 Top Individual Performers – VAT Reduction
| Rank | Result | Location | Timeframe |
|---|---|---|---|
| #1 | −5.58 lbs | DexaFit Jacksonville | 9–12 months |
| #2 | −3.98 lbs | DexaFit Long Island | ≤6 months |
| #3 | −3.41 lbs | DexaFit Minneapolis | ≤6 months |
These results exceed the 99th percentile (-2.32 lbs). 5.58 pounds of visceral fat is roughly 2.5 liters of inflammatory tissue—picture five or six small footballs worth of metabolically active, cytokine-secreting organ fat that was wrapped around this person's liver, kidneys, and pancreas. All of it eliminated in under a year.
Results at this magnitude typically accompany dramatic overall body composition changes—note that Jacksonville's top VAT performer also achieved the network's top body fat reduction. When someone moves this much visceral fat, they've fundamentally altered their metabolic environment.
🥇 Top Location Rankings – VAT Reduction
| Rank | Location | Mean Change |
|---|---|---|
| 1 | DexaFit Tampa | −0.83 lbs |
| 2 | Eminence Hormone and Weight Loss Center (Powered by DexaFit) | −0.69 lbs |
| 3 | DexaFit Vancouver | −0.67 lbs |
DexaFit Vancouver appears on multiple leaderboards—body fat, visceral fat, and bone density. Whatever their client population is doing, it's working across multiple systems simultaneously.
Lean Mass: The Currency You Can't Counterfeit
Most people trying to lose weight lose muscle along with fat. This is the dirty secret of the diet industry. You go on a caloric deficit, drop 20 pounds on the scale, and everyone congratulates you. But what actually happened? If you didn't resistance train aggressively and consume adequate protein, a third of that weight loss was lean tissue.
The standard weight loss playbook is, in effect, a muscle-wasting playbook. The consequences compound over time.
A 2023 meta-analysis in the Journal of Cachexia, Sarcopenia and Muscle found that low skeletal muscle mass was associated with a 57% increased risk of all-cause mortality [3]. A 2014 study in the American Journal of Medicine analyzing NHANES III data found that muscle mass index was inversely associated with mortality risk in older adults—those in the highest quartile of muscle mass had significantly lower mortality than those in the lowest quartile, even after adjusting for traditional cardiovascular risk factors [4].
There's a reason clinicians increasingly refer to skeletal muscle as "the organ of longevity." The muscle you carry in your 40s and 50s largely determines whether you can still get off the floor unassisted in your 80s.
What the Distribution Shows - Lean Mass Change by Percentile
The distribution reveals the genuine difficulty of building muscle—and the diversity of our client population:
The median change of -0.2 lbs is essentially within the margin of error—more or less maintained. For a population that includes people in aggressive caloric deficits, clients focused on fat loss rather than hypertrophy, and individuals whose primary goal is metabolic health rather than muscle gain, holding steady is actually a win. Maintaining muscle while losing fat is one of the hardest things to do in fitness.
But look at the upper percentiles. Gaining 5-8 lbs of lean mass in a year through resistance training and adequate protein—that's what sustained, intelligent natural effort produces. The 75th percentile gain of 2.7 lbs represents meaningful progress for most recreational athletes.
🏆 Top Individual Performers – Lean Mass Gain
| Rank | Result | Location | Timeframe |
|---|---|---|---|
| #1 | +35.5 lbs | DexaFit Tempe | 6–9 months |
| #2 | +30.4 lbs | DexaFit Tempe | ≤6 months |
| #3 | +29.8 lbs | DexaFit Atlanta | ≤6 months |
These numbers are well beyond the 99th percentile (+15 lbs). We verified them—they're legitimate DEXA measurements. But context matters for interpretation.
Results at this magnitude typically reflect one of several scenarios: medically supervised hormone protocols, significant muscle regain after illness, injury, or extended inactivity, or an exceptional anabolic response in someone new to resistance training.
DexaFit serves clients across the full spectrum—from natural athletes to those working with longevity physicians on comprehensive protocols, to post-surgical patients rebuilding lost tissue. The data captures all of it. The outliers show what's possible when every variable is optimized. The percentiles show what dedicated natural effort typically produces.
For most people training naturally with good nutrition, targeting the 75th-90th percentile range (+2.7 to +5.8 lbs annually) represents excellent progress.
🥇 Top Location Rankings – Lean Mass Gain
| Rank | Location | Mean Change |
|---|---|---|
| 1 | Eminence Hormone and Weight Loss Center (Powered by DexaFit) | +2.66 lbs |
| 2 | 8 West Clinic (Powered by DexaFit) | +1.61 lbs |
| 3 | Bucky Plastic Surgery Ardmore (Powered by DexaFit) | +0.30 lbs |
Eminence Hormone and Weight Loss Center leads in both body fat reduction and lean mass gain—the combination reflecting their clinical focus on body recomposition through medically supervised protocols.
The A/G Ratio: Where Your Fat Lives
The Android-to-Gynoid ratio measures fat distribution: how much you carry around your midsection (android) versus your hips and thighs (gynoid).
You've heard the shorthand: "apple" versus "pear" body shapes. Apple-shaped individuals carry more fat around their abdomen—the android pattern. Pear-shaped individuals store it in hips and thighs—the gynoid pattern. The distinction isn't just cosmetic. Apple-shaped fat distribution correlates with insulin resistance, cardiovascular disease, and mortality, even at the same total body fat percentage. The fat's location matters as much as its quantity.
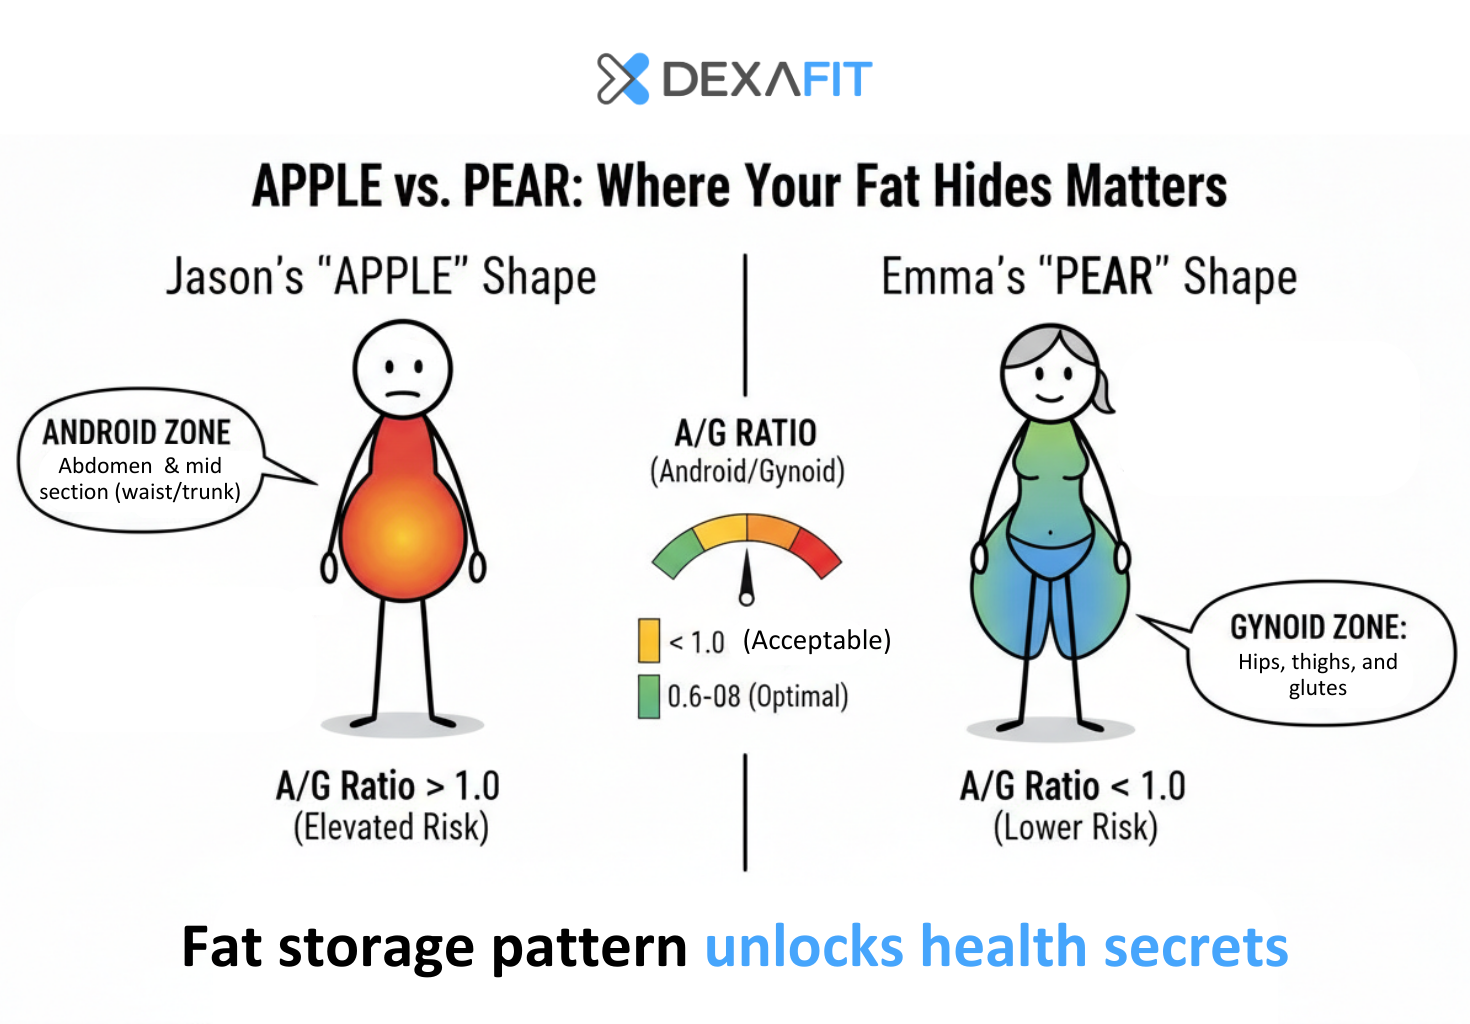
Before we could directly quantify visceral fat with DEXA, the A/G ratio was one of the best proxies available for metabolic risk. Now that we can measure VAT directly, the A/G ratio is somewhat less critical—we're looking at the actual visceral fat rather than inferring it from distribution patterns. But it remains useful, particularly as a motivational signal and a marker of overall metabolic improvement.
What's a good A/G ratio? Some researchers consider 0.6 to 0.8 the optimal range—indicating a favorable gynoid-dominant distribution. But anything below 1.0 is a reasonable goal. A ratio above 1.0 means you're carrying more fat in the metabolically dangerous abdominal zone than in the safer hip/thigh region.
What the Distribution Shows - A/G Ratio Change by Percentile
The median improvement of -0.032 represents gradual redistribution toward a healthier pattern. At the 90th percentile, clients achieved a shift of nearly a quarter-point—enough to meaningfully change risk category for someone starting with an elevated ratio. For someone starting at 1.1, this would bring them below the 1.0 threshold and into healthier territory.
🏆 Top Individual Performers – A/G Ratio Improvement
| Rank | Result | Location | Timeframe |
|---|---|---|---|
| #1 | −1.058 | DexaFit Dallas | ≤6 months |
| #2 | −1.008 | DexaFit Seekonk | ≤6 months |
| #3 | −0.792 | DexaFit Boston | ≤6 months |
These results exceed the 99th percentile (-0.489). A reduction of 1.0 represents a dramatic shift in fat distribution pattern—someone who started with dangerous abdominal dominance fundamentally restructured where their body stores fat. For someone starting at 1.5, this would bring them down into the optimal 0.6-0.8 range within months.
Bone Mineral Density: The Foundation You're Standing On
The metric nobody thinks about until it's too late.
Bone mineral density is a long-game metric. You don't see dramatic changes month-to-month the way you might with body composition. The skeleton remodels slowly—osteoclasts break down old bone, osteoblasts build new bone, and the net balance shifts gradually over years and decades.
The uncomfortable reality: after age 50, bone breakdown outpaces bone formation for most people [5]. The rate varies—women lose faster than men, especially after menopause—but the direction is consistent. According to the NCBI Bookshelf review on osteoporosis epidemiology, low areal bone mineral density by DEXA remains the single best predictor of subsequent fracture beyond age [6].
Why does this matter so much? Consider the statistics on hip fractures. A 2019 systematic review found that the mean one-year mortality rate following hip fracture is approximately 22%—and some studies report rates as high as 35% [7]. Only 40-60% of survivors recover their pre-fracture level of mobility and independence [8].
Roughly one in four people over 65 who break a hip will not be alive one year later.
What the Distribution Shows - BMD Change by Percentile
The median is essentially flat—which in context is good news. When the population default is losing bone density, maintaining it means you're holding ground that most people are quietly surrendering. The 75th percentile and above show actual gains, which requires consistent resistance training, impact activities, and adequate protein.
With 91% of locations maintaining or improving bone density, the DexaFit population is defying the typical age-related trajectory.
🏆 Top Individual Performers – BMD Improvement
| Rank | Result | Location | Timeframe |
|---|---|---|---|
| #1 | +0.124 g/cm² | DexaFit Atlanta | ≤6 months |
| #2 | +0.112 g/cm² | DexaFit Kansas City | 6-9 months |
| #3 | +0.097 g/cm² | DexaFit Orange County | ≤6 months |
These results exceed the 99th percentile (+0.076 g/cm²). The population norm after age 50 is losing 0.5-1% of bone density per year. These individuals didn't just stop the decline—they reversed it substantially, with the top performer achieving this in six months or less.
🥇 Top Location Rankings – BMD Improvement
| Rank | Location | Mean Change |
|---|---|---|
| 1 | DexaFit Vancouver | +0.005 g/cm² |
| 2 | DexaFit Tallahassee | +0.005 g/cm² |
| 3 | DexaFit Los Alamitos | +0.004 g/cm² |
DexaFit Los Alamitos shows up on both fat reduction lists and the BMD list, suggesting comprehensive metabolic improvement rather than single-metric optimization.
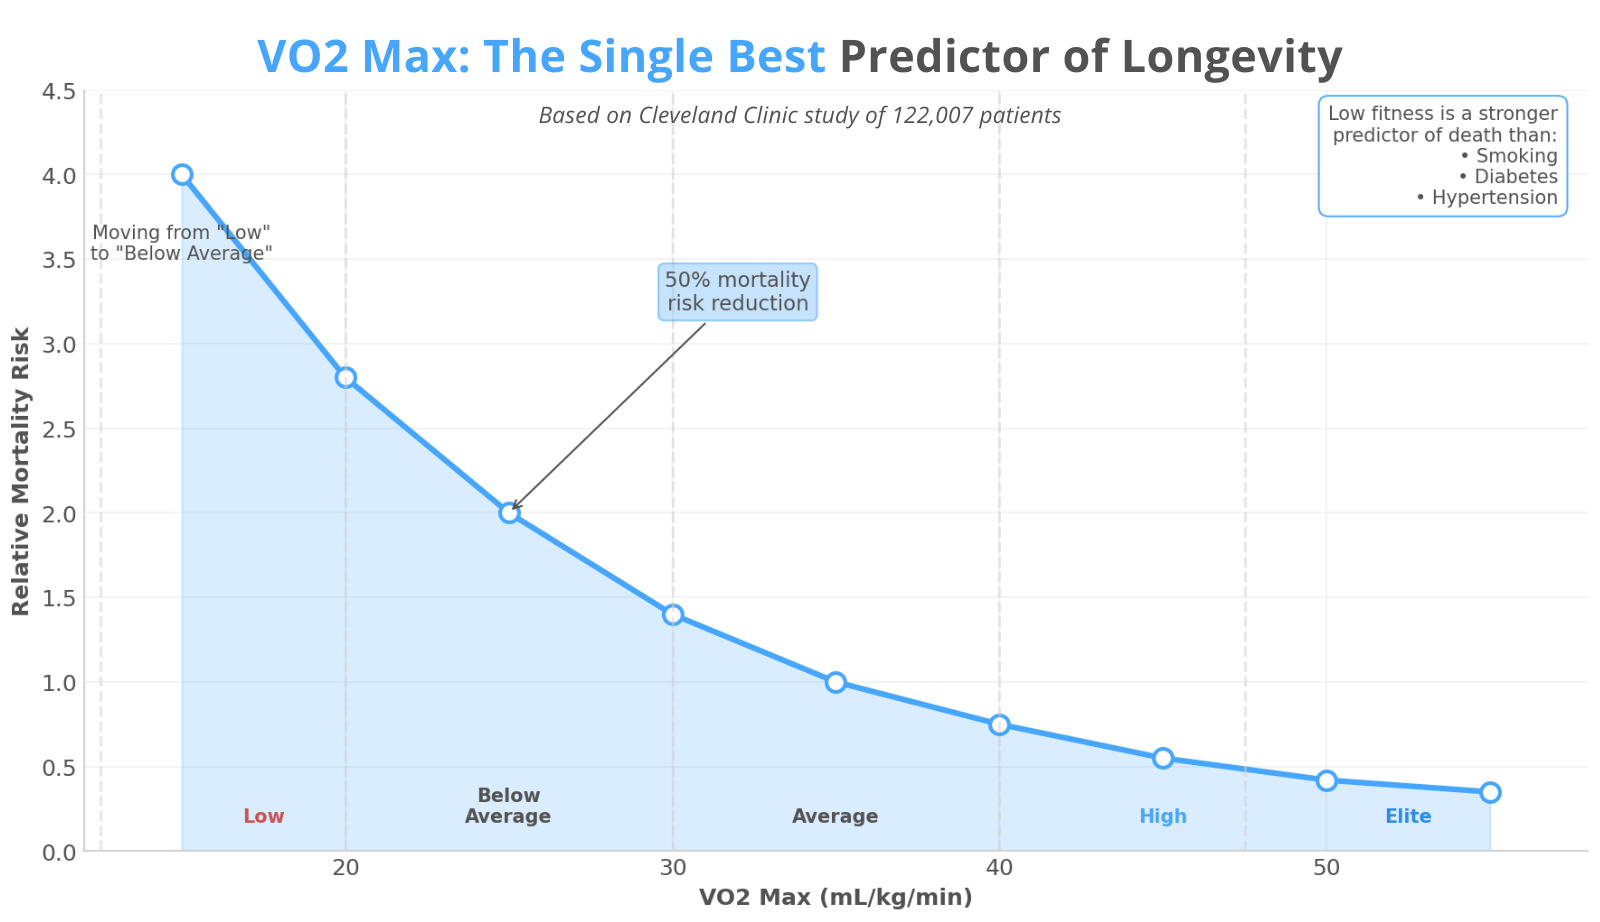
VO2 Max: The Single Best Predictor of How Long You'll Live
If you had to pick one metric from this entire analysis—one number that best predicts whether you'll be alive and functional in 20, 30, 40 years—it would probably be this one.
VO2 max measures maximal oxygen uptake: the ceiling of your cardiovascular system's capacity to transport and utilize oxygen during maximal exertion. It's essentially a measure of how powerful your aerobic engine is.
A 2018 study in JAMA Network Open followed 122,007 patients who underwent exercise treadmill testing at the Cleveland Clinic. The findings: cardiorespiratory fitness was more strongly associated with survival than smoking, diabetes, or hypertension. Patients in the lowest fitness quartile had mortality rates nearly 4 times higher than those in the highest quartile. Moving from "low" to merely "below average" fitness cut mortality risk by approximately 50% [9].
Low fitness is a stronger predictor of death than smoking, diabetes, or hypertension. And unlike those conditions, it's entirely modifiable through behavior.
A 2022 study in the Journal of the American College of Cardiology analyzed over 750,000 U.S. veterans—the largest cardiorespiratory fitness dataset ever assembled. Each 1-MET increase in fitness (roughly 3.5 mL/kg/min of VO2 max) was associated with a 13-15% reduction in mortality risk, regardless of age, BMI, sex, or comorbidities [10].
What the Distribution Shows - VO2 Max Change by Percentile
The median improvement of 1.55 mL/kg/min translates to roughly 6-7% mortality risk reduction. At the 75th percentile, clients gained nearly 4 points—equivalent to roughly 15-17% mortality risk reduction. The 90th percentile shows gains of over 7 points, which represents moving up an entire fitness category.
VO2 max is also the metric that responds most dramatically to intervention. Unlike bone density, which moves glacially, VO2 max can improve significantly within weeks to months of starting a structured cardio program.
🏆 Top Individual Performers – VO2 Max Improvement
| Rank | Result | Location | Timeframe |
|---|---|---|---|
| #1 | +10.8 mL/kg/min | DexaFit Seekonk | ≤6 months |
| #2 | +10.1 mL/kg/min | DexaFit Tempe | ≤6 months |
| #3 | +9.7 mL/kg/min | DexaFit Scottsdale | ≤6 months |
These results are right at the 99th percentile (+10.27 mL/kg/min)—impressive but achievable through dedicated cardiovascular training. Unlike the lean mass outliers, these VO2 improvements fall within the expected range for someone who commits seriously to cardiorespiratory fitness.
Each 3.5 mL/kg/min improvement is associated with roughly 13-15% lower mortality risk. A 10.8-point improvement translates to approximately 40-45% reduction in all-cause mortality risk—achieved in six months or less through structured cardiovascular training, measured and verified.
🥇 Top Location Rankings – VO2 Max Improvement
| Rank | Location | Mean Change |
|---|---|---|
| 1 | DexaFit Scottsdale | +3.93 mL/kg/min |
| 2 | DexaFit Tempe | +3.24 mL/kg/min |
| 3 | DexaFit Orange County | +2.22 mL/kg/min |
The Arizona cluster (Scottsdale, Tempe) dominates the VO2 max rankings. Year-round outdoor training weather likely plays a role, but so does what appears to be a regional emphasis on cardiorespiratory fitness testing and improvement.
What the Data Actually Tells Us
First, direction matters. Every location moved the right way on body fat and visceral fat. The vast majority improved on bone density. When people measure, they manage. When they manage with precision, they improve.
Second, the percentiles reveal what dedicated effort typically produces. Median results show meaningful progress; 75th-90th percentile results show what's achievable with serious commitment. These are the numbers most people should use as targets.
Third, the top performers prove what's possible at the extremes. Some of these results involve pharmaceutical support, medical supervision, or exceptional circumstances. They represent the ceiling, not the expectation. But knowing they exist changes the frame—it's one thing to wonder whether dramatic transformation is possible, another to see it documented.
Fourth, certain locations consistently outperform—Vancouver, Los Alamitos, the Arizona cluster for VO2—suggesting that local factors matter. Coaching quality, community, programming, climate. The data doesn't tell us exactly what's working, but it tells us where to look.
Fifth, international results track domestic results. Singapore, Bulgaria, South Africa, Canada—the feedback loop works everywhere. Precision health optimization isn't culturally specific.
The formula isn't complicated—measurement, feedback, sustained effort—but the execution remains difficult.
The Uncomfortable Conclusion
The fitness industry sells motivation—inspiration, community, aesthetics. These aren't worthless. They get people started. But they're also not sufficient for lasting change.
What changes behavior is feedback. What changes bodies is precision. And what changes lives is the slow accumulation of evidence that you're actually on the right track—or the early warning that you're not.
We spent 2025 watching people across four continents get that feedback. The vast majority got better. Some of them got dramatically better. And collectively, they demonstrated something that bears repeating: when you give people precise information about their bodies, many of them will actually use it.
The technology exists. The data is there. The research is clear on what matters.
The only remaining question is whether you're willing to look.
References
Hales CM, Carroll MD, Fryar CD, Ogden CL. Prevalence of obesity and severe obesity among adults: United States, 2017-2018. NCHS Data Brief. 2020;(360):1-8.
Liu Y, Wang Y, Wang J, et al. Association between visceral adiposity and cardiovascular disease: A systematic review and meta-analysis. Atherosclerosis. 2025;401:119091.
Gao Q, Hu K, Yan C, et al. Association of sarcopenia and all-cause mortality in older adults: A meta-analysis. J Cachexia Sarcopenia Muscle. 2023;14(3):1164-1176.
Srikanthan P, Karlamangla AS. Muscle mass index as a predictor of longevity in older adults. Am J Med. 2014;127(6):547-553.
Johns Hopkins Medicine. Osteoporosis: What you need to know as you age. Johns Hopkins Health. 2025.
Rosen CJ. The epidemiology and pathogenesis of osteoporosis. In: Feingold KR, Anawalt B, Blackman MR, et al., editors. Endotext. South Dartmouth (MA): MDText.com, Inc.; 2020.
Downey C, Kelly M, Quinlan JF. Changing trends in the mortality rate at 1-year post hip fracture - a systematic review. World J Orthop. 2019;10(3):166-175.
US Preventive Services Task Force. Screening for osteoporosis to prevent fractures: US Preventive Services Task Force recommendation statement. JAMA. 2025;333(5):458-467.
Mandsager K, Harb S, Cremer P, Phelan D, Nissen SE, Jaber W. Association of cardiorespiratory fitness with long-term mortality among adults undergoing exercise treadmill testing. JAMA Netw Open. 2018;1(6):e183605.
Kokkinos P, Faselis C, Samuel IBH, et al. Cardiorespiratory fitness and mortality risk across the spectra of age, race, and sex. J Am Coll Cardiol. 2022;80(6):598-609.
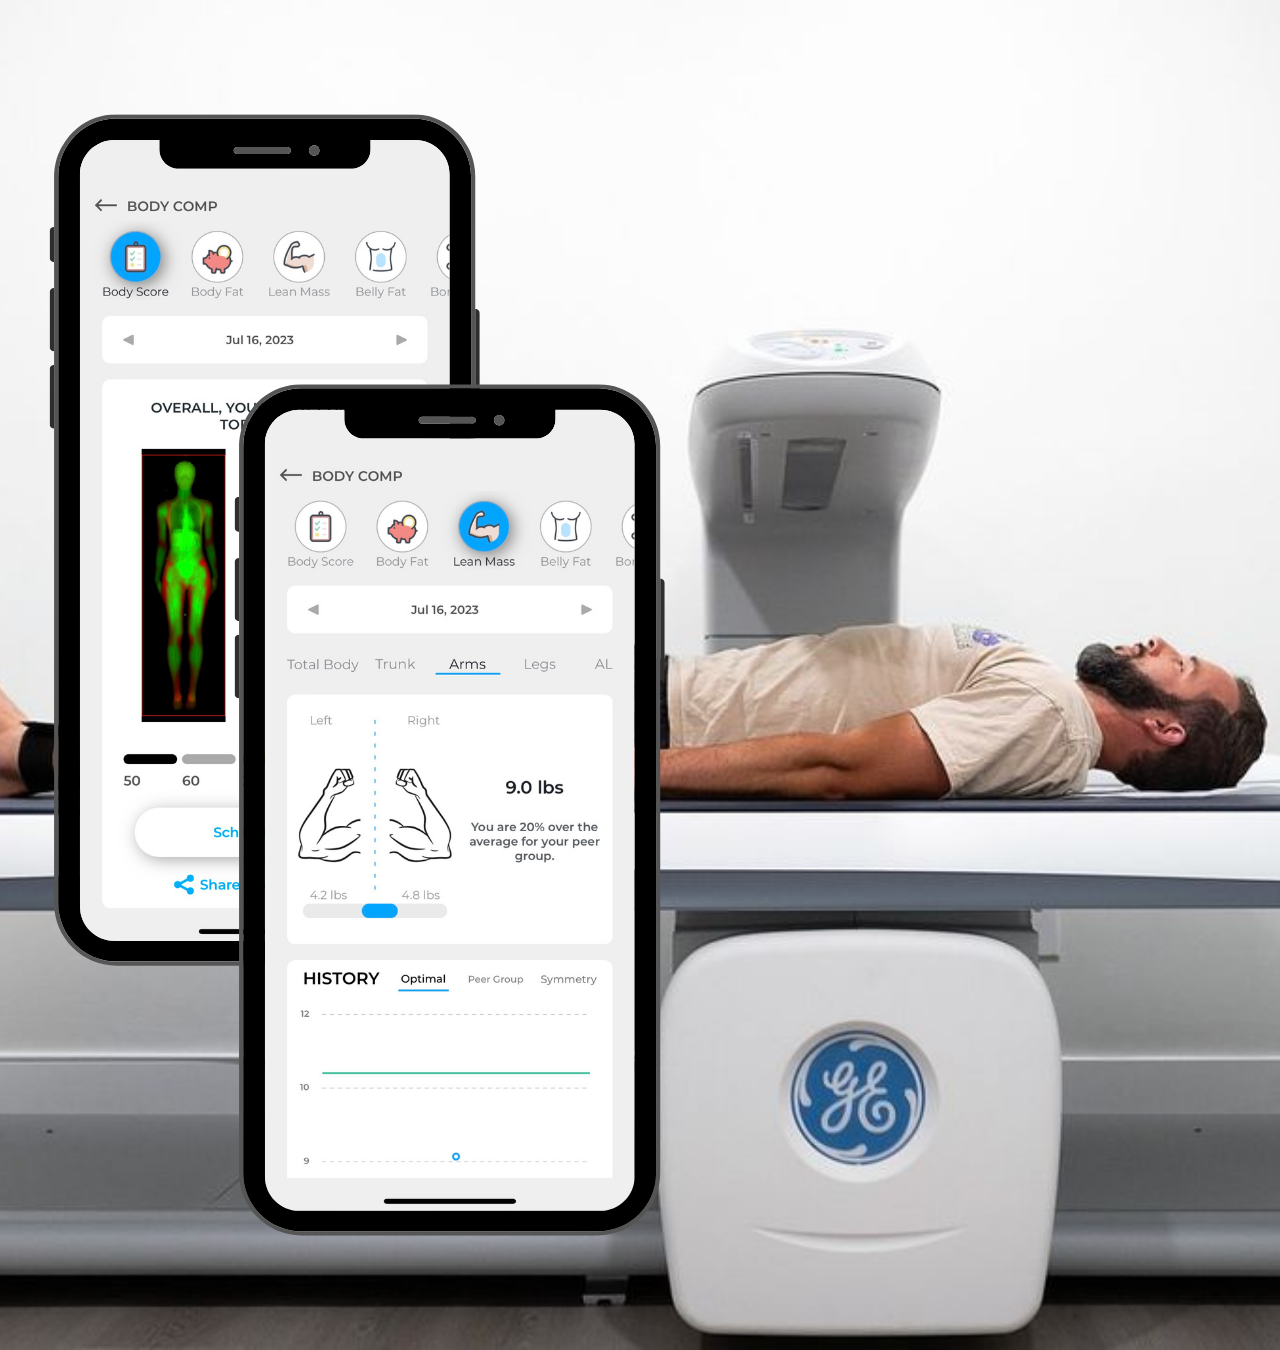
Get DexaFit across North America, Europe, Asia, and South Africa—offering DEXA body composition analysis, VO2 Max testing, resting metabolic rate assessments, lab testing, and more. This analysis reflects year-over-year changes in users who completed follow-up scans during 2025.
