
Ever wondered how a DEXA scan can tell you exactly how many pounds of lean, fat, and bone mass you have? For decades, DEXA has stood as the gold standard in body composition analysis, trusted by medical professionals to diagnose osteoporosis, researchers to track the effects of interventions, and elite athletes to optimize their performance. From Olympic training centers and professional sports teams to major medical institutions, this remarkable technology has quietly revolutionized how we understand the human body. Let's take a fascinating journey through the science behind this precision instrument.
Jump to Section:
The Magic of Dual Energy Beams
DEXA stands for "Dual-Energy X-ray Absorptiometry," a technology that emerged from bone density research in the 1980s and evolved into one of the most sophisticated body composition tools available today. Imagine having x-ray vision that can not only see through your body, but also identify exactly what type of tissue it's looking at. That's essentially what DEXA does.
Why This Matters: The Problem with Other Methods
Before diving into how DEXA works, it's worth understanding why we need such sophisticated technology in the first place. Most common body composition methods have significant limitations that become apparent when we zoom in from population-level to individual assessment.
Think of it like photography: You can photograph the same building with a wide-angle lens (capturing the whole city block), a standard lens (showing just the building), or a macro lens (revealing intricate architectural details). Each lens captures the same subject but provides completely different information and usefulness depending on what you need to know.
BMI (Body Mass Index): This is like the wide-angle lens of health assessment. BMI simply divides your weight by your height squared and works reasonably well for large population studies – just as a wide-angle photo can show general urban density trends. But zoom in to individuals, and BMI becomes profoundly problematic. A muscular athlete and a sedentary person of identical height and weight get the exact same BMI score, despite having completely different health profiles. BMI can't distinguish between the "architectural details" of your body – whether that weight comes from muscle, fat, or bone.

Smart Scales/BIA (Bioelectrical Impedance): These are like using a standard camera lens with poor focus. They send electrical currents through your body, measuring resistance to estimate body fat. The fundamental flaw? Electricity takes the path of least resistance, often bypassing pockets of fat entirely and making broad assumptions about water distribution throughout your body. Your hydration level, recent exercise, room temperature, and even calluses on your feet can dramatically skew results. These devices also rely on population averages that may not apply to your unique physiology – like trying to assess individual architectural features using citywide construction standards.
Skinfold Calipers: These represent the macro lens approach but with a fundamental limitation – they only capture what's visible on the surface. Calipers measure fat thickness at specific body sites using mathematical formulas, but they assume that subcutaneous fat (under the skin) represents your total body fat proportionally. This method completely misses visceral fat wrapped around your organs and struggles with individuals whose fat distribution doesn't match standard patterns. It's like judging a building's entire structure by only photographing its exterior walls.
The Individual vs. Population Problem: Here's the key insight – methods that show useful trends across thousands of people often fail dramatically when applied to individuals. It's the difference between aerial photography that reveals traffic patterns across a city (useful for urban planning) versus trying to use that same aerial view to assess whether your individual car needs maintenance (completely useless).

BMI might correctly identify that 70% of a population is overweight, but it will incorrectly classify numerous muscular, healthy individuals as obese and people with dangerously little muscle as not obese.
BIA scales might show accurate average body fat trends in research studies, but for you personally, being off by up to 20% isn't even the biggest problem – the real issue is that these methods provide no meaningful insights into muscle quality, visceral fat accumulation, or bone density. They can't tell you if you're losing dangerous belly fat or gaining protective muscle mass, whether your bones are strong or deteriorating, or if your muscle distribution is balanced. You're left with a single, often inaccurate number that tells you virtually nothing about your actual health profile.
The fundamental issue with all these methods? They rely on assumptions, estimates, and indirect measurements that work for groups but break down for individuals.
DEXA, by contrast, is like having Superman's X-ray vision with the ability to adjust across the entire spectrum of imaging – it can see through to the inside, not just the surface, and dial in to examine exactly what type of tissue it's looking at, pixel by pixel, without relying on population averages or assumptions about your unique body.
How DEXA Distinguishes Your Tissues
Your body is made up of three main types of tissue that respond differently to low dose x-ray energy: fat tissue (low density), lean tissue like muscle and organs (medium density), and bone tissue (high density). Using two different energy levels, DEXA creates unique absorption patterns for each tissue type:
Fat tissue: Absorbs both energy levels similarly
Lean tissue: Shows moderate difference between the two energies
Bone tissue: Shows dramatic difference - blocks the low energy beam much more than the high energy beam
Think of it like having "tissue color vision" - just as your eyes use three color receptors to distinguish millions of colors, DEXA's two energy beams can precisely identify tissue types that would look identical to a single-energy system.
How the Measurement Works
The high energy beam determines how much is bone versus soft tissue at each measurement point, based on how much gets absorbed versus transmitted through to the receiver below.
The low energy beam analyzes the soft tissue portion, determining how much is lean mass (muscle, water, organs and other non-fat, non- bone tissue) versus fat tissue.
By comparing these absorption patterns, the scanner creates a precise map of your body composition from a simple, open-aired scan that takes less than 8 minutes.
Journey Through DEXA Analysis
Let's now follow the DEXA scanner as it analyzes your body. As you lie comfortably on the open scanning table in your regular clothes (just no metal), the scanner arm systematically moves above you from head to toe. You simply relax and stay still while the arm glides across, positioning itself at thousands of measurement points.

DexaFit DEXA Scan
How the Dual-Energy System Works:
Think of each measurement point as creating a "pixel" in the image of your body. At every pixel location:
Step 1: The High Energy Beam passes through your body, and the amount that gets absorbed versus the amount that reaches the receiver below determines the total density at that location. This measurement tells the scanner how much bone versus soft tissue is present in that pixel.
Step 2: The Low Energy Beam is more sensitive to the differences between fat and lean tissue. The amount of this beam that gets absorbed helps the scanner determine how much of the soft tissue (the non-bone portion) is fat versus lean mass (muscle, organs, water).
Step 3: Algorithms compare the absorption patterns of both energy levels, and the scanner's software calculates the precise composition of each measurement area. The different absorption ratios create unique "fingerprints" for each tissue type:
Real-World Examples:
Example 1: Hip Area - All Three Tissues
The scanner measures both energy beams at a location over your hip. Based on the absorption patterns, the algorithm determines this area contains:
25% bone (from the high energy absorption data)
50% lean tissue (calculated from both beams)
25% fat (determined by low energy beam analysis)
Example 2: Muscle Area - Pure Lean Tissue At a location over your bicep, the absorption pattern indicates nearly 100% lean tissue with minimal bone or fat.
Example 3: Soft Tissue Area - Mixed Composition In your abdomen, the scanner might find:
60% lean tissue
40% fat tissue
Minimal bone
Building Your Complete Body Map
Now imagine this process happening simultaneously across thousands of pixels covering your entire body. The DEXA scanner:
Analyzes each pixel using the dual X-ray technique
Calculates tissue percentages for every pixel
Converts to actual mass using tissue densities
Sums everything up to give you totals

The result is a detailed map showing exactly where your fat, muscle, and bone are distributed throughout your body – information that's impossible to obtain with any other practical measurement method.
Total Body Composition
Total Fat Mass = Sum of fat from all pixels
Total Lean Mass = Sum of lean tissue from all pixels
Total Bone Mass = Sum of bone from all pixels
Total Body Mass = Fat + Lean + Bone
Regional Analysis
The scanner can also group pixels by body region:
Arms: Left arm fat, lean, bone vs. Right arm
Legs: Left leg composition vs. Right leg
Trunk: Your torso's composition
Android region: "Apple shape" belly fat area
Gynoid region: "Pear shape" hip and thigh area
BMC vs. BMD: Understanding Bone Measurements
DEXA provides two important bone measurements that often confuse people:
Bone Mineral Content (BMC)
What it is: The total amount of bone mineral in grams
Think of it as: The actual weight of minerals in your bones
Example: "You have 2,847 grams of bone mineral in your spine"
Bone Mineral Density (BMD)
What it is: Bone mineral content divided by bone area (g/cm²)
Think of it as: How tightly packed your bone mineral is
Example: "Your spine BMD is 1.15 g/cm²"
Why both matter:
BMC tells you the absolute amount of bone you have
BMD tells you how dense (strong) your bones are
A tall person might have high BMC but normal BMD
BMD is what doctors use to diagnose osteoporosis
The Android vs. Gynoid Fat Story
DEXA can identify where your fat is distributed, which is critical for your health:
Android Fat ("Apple Shape")
Location: Belly and upper body
Health impact: Higher risk for heart disease and diabetes
Why it matters: This fat is more metabolically active
Gynoid Fat ("Pear Shape")
Location: Hips, thighs, and buttocks
Health impact: Generally lower health risks
Why it matters: This fat is less metabolically active
The Android/Gynoid ratio helps assess your health risk profile.

Visceral Fat: The Hidden Danger
Perhaps most importantly, DEXA can estimate visceral fat – the dangerous fat wrapped around your internal organs that you can't see or feel. This "hidden" fat is strongly linked to:
Type 2 diabetes
Heart disease
Certain cancers
Metabolic syndrome
Even people with normal weight can have unhealthy levels of visceral fat, making DEXA invaluable for true health assessment.
The Precision Advantage
Unlike bathroom scales that just give you total weight, or body fat scales that estimate using electrical impedance, DEXA directly measures each tissue type with both exceptional precision and accuracy. This distinction matters enormously:
Precision means getting consistent results between scans – essential for tracking changes over time. Accuracy means those results reflect reality. Most other methods struggle with both, but DEXA excels at delivering reliable, repeatable measurements that truly represent your body composition.
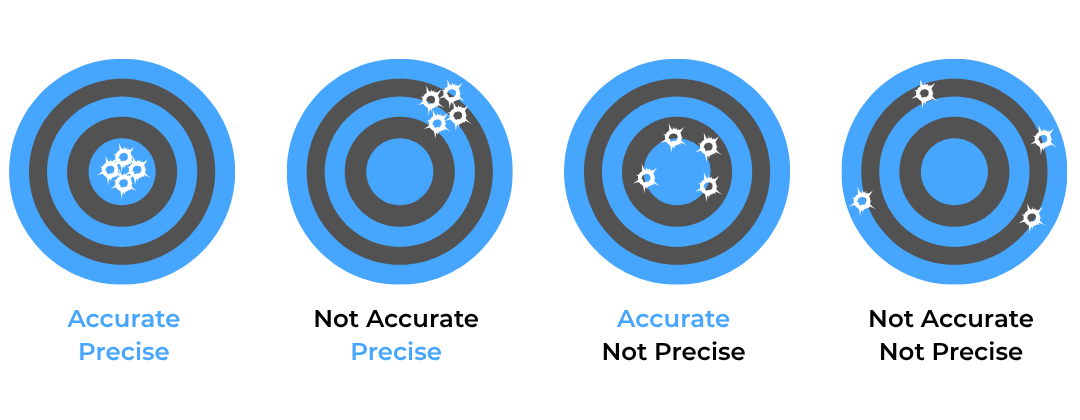
Compared to BIA smart scales, InBody, skinfold calipers, and other methods—which often lack accuracy or consistency—DexaFit’s DEXA scans are the only practical method both clinically accurate and precise.
DEXA's three-compartment model – separating fat, lean mass, and bone – provides insights that directly connect to your long-term health and quality of life. This isn't just about looking good; it's about aging successfully:
Visceral Fat Assessment: DEXA can estimate the dangerous fat wrapped around your organs, strongly linked to diabetes, heart disease, and metabolic dysfunction. Managing visceral fat levels helps preserve your metabolic health as you age.
Bone Density Measurement: Beyond body composition, DEXA reveals bone strength – your foundation for maintaining independence later in life. Strong bones mean fewer fractures, less frailty, and the ability to stay active and self-sufficient in your later years.
Lean Mass and Distribution: DEXA tracks not just how much lean mass you have, but where it's distributed. Balanced lean tissue and adequate muscle mass are your insurance policies against age-related muscle loss (sarcopenia), helping you maintain strength, balance, and functional capacity throughout your life.
This precision allows you to:
Track real progress: See if you're gaining lean mass while losing fat
Identify imbalances: Spot muscle loss on one side of your body
Monitor bone health: Catch bone loss before fractures occur
Assess health risks: Understand your fat distribution patterns
Plan for longevity: Make informed decisions about exercise and nutrition that impact how you'll age
The difference between living independently with vitality in your 80s and 90s versus becoming frail and dependent often comes down to the very metrics DEXA measures with unparalleled precision.
Conclusion: Your Body's Complete Story
A DEXA scan is more than a snapshot—it’s a structural blueprint. Using the laws of physics, it measures what can’t be seen in the mirror: your fat, muscle, and bone mass—down to the gram.
Whether you’re training for performance, navigating weight loss, or simply aiming to age with strength, DEXA gives you something rare: clarity. It reveals the metrics that matter most for long-term health—visceral fat that strains your metabolism, bone density that protects your independence, and lean mass that preserves your strength, stability, and resilience.
Each number on your DexaFit report isn’t just a data point—it’s the result of thousands of calibrated pixel measurements, woven together to tell the story of how your body is built—and how it’s changing.
