
Can you trust your DEXA results when you scan at different locations?
There's a law in economics that quietly governs most of modern health tracking. Goodhart's Law: when a measure becomes a target, it ceases to be a good measure.
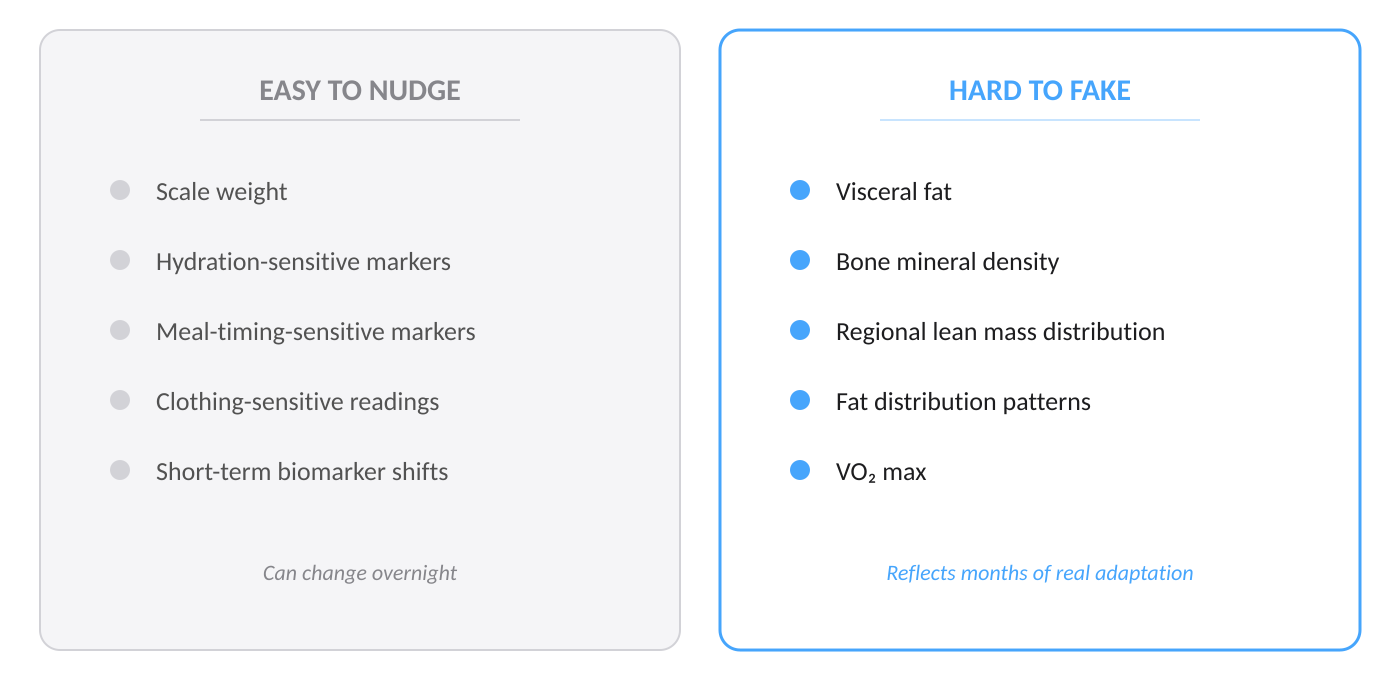
Step on a smart scale every morning and you can game the number with hydration timing, meal timing, the clothes you're wearing. Get a blood draw and certain markers normalize within hours of a single intervention. These measurements have value. But they're soft—responsive to short-term manipulation as easily as to genuine biological change.
Most common health metrics can be gamed overnight. Proof-of-work metrics like visceral fat and bone density can't. They only move when your biology actually changes.
People spending hundreds or thousands of dollars a month on longevity protocols, training programs, and medications are starting to figure this out. The question shifts. It stops being what should I try next and becomes something harder: how do I know what's actually working.
That's where proof-of-work metrics come in. Measurements that can't be gamed, can't be normalized overnight, can't be faked. Your visceral fat levels. Your bone mineral density. Your regional lean and fat mass distribution. Your VO₂ max. These aren't just hard to manipulate—most of them are invisible to every other tool you own. No scale, no wearable, no blood panel can tell you how much fat sits around your organs, how your lean mass distributes between your left and right side, or whether your bone density is trending up or down over two years.
For most people, DEXA and metabolic testing are the only practical way to see these metrics directly. They are outputs of sustained biological adaptation—proof that reflects months and years of accumulated effort, or its absence.
DEXA gives you the baseline that makes the rest of the picture easier to read.
As demand for this kind of testing grows, so does the availability. DexaFit locations now span multiple cities across four continents. Users who track body composition quarter over quarter increasingly scan wherever they happen to be—a quarterly check in Houston, then a scan on a work trip to Dallas; a baseline in Singapore, a follow-up in Seattle.
Most of the time, the numbers track. Trends hold.
But occasionally, a user scanning at a new location notices something slightly off. Lean mass reads a few pounds higher than expected. Body fat sits a couple of points different from the last result. The explanation is almost always the same: a difference in the instrument's reference frame, not a change in the body.
The Data
Within the GE ecosystem, cross-location lean mass agreement lands at 1.8 lbs median—less than a tall glass of water.
If you've scanned at DexaFit before, you know the drill. Before every visit, you're advised on protocols—hydration, timing, clothing, positioning—designed to ensure the most reliable results, especially over time. One of the key recommendations: scan on the same model you scanned on previously. Consistency is king.
But life doesn't always cooperate. People travel. People move. Power users who scan more often than most tend to scan wherever is convenient, which might be a different city than last time. This analysis is for them.
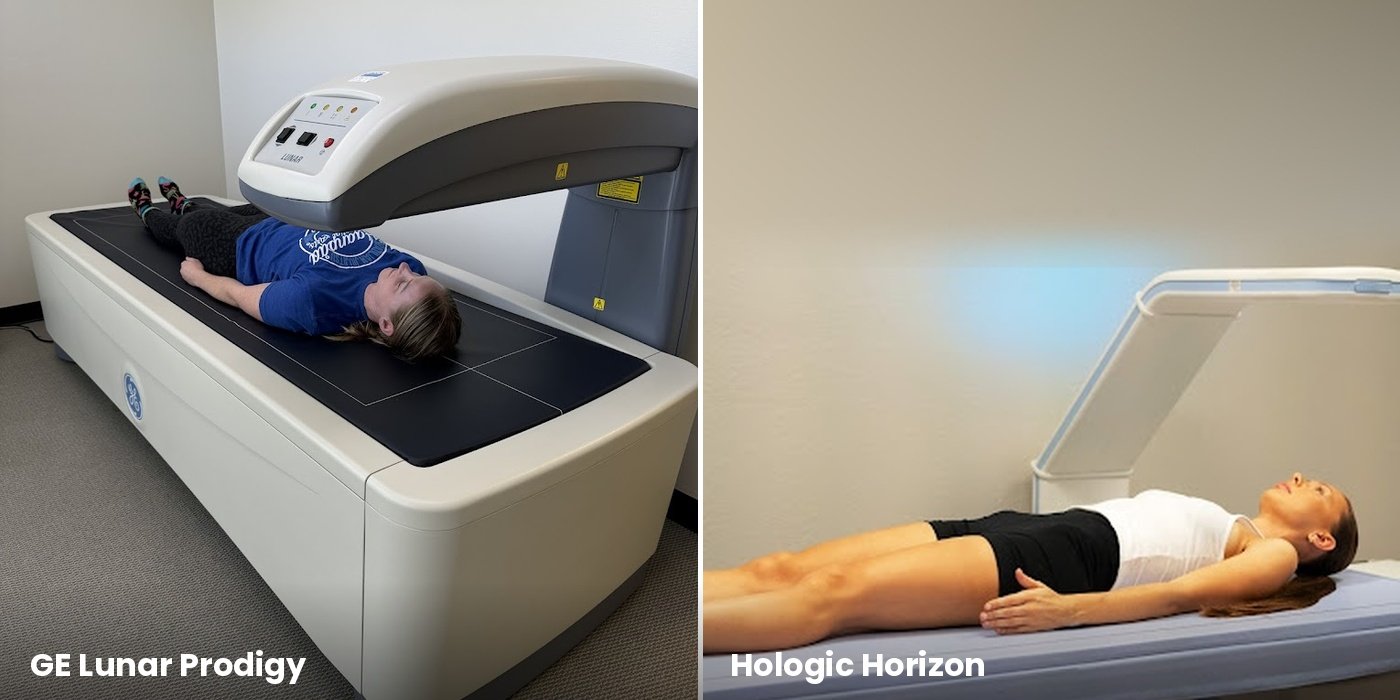
We examined every case in our network where the same verified person scanned at two different DexaFit locations within 30 days. We cross-referenced device serial numbers, filtered out duplicate records and data artifacts, and categorized each comparison by manufacturer and model—GE to GE, GE to Hologic, same model, different model—to isolate how precise scans are when users visit different systems.
These weren't designed experiments. They were organic comparisons from real users who happened to scan at more than one location—something that only becomes possible at scale. DexaFit has conducted hundreds of thousands of scans across four continents since 2011. Our within-GE comparison cohort is larger than all but two published cross-calibration studies we're aware of, and unlike laboratory studies, ours reflects real-world conditions: different cities, different days, different technicians, different GE scanner models. The agreement still falls within published single-machine precision ranges.
Lean mass showed a median difference of 1.8 lbs—roughly 1.5% of total lean mass for a typical person. Less than a tall glass of water. Over three-quarters of comparisons agreed within 3 lbs. Body fat percentage showed a median difference of under 1 percentage point, with 80% of comparisons agreeing within 2 points.
When we narrowed to comparisons within 14 days—a window where meaningful body composition change is physiologically unlikely—the numbers tightened further: 1.3 lbs lean mass and <1pt body fat.
Breaking it down by model makes the pattern clearer. GE's body composition lineup includes the Prodigy family (Prodigy and iDXA):
| GE Platform Comparison | Lean Mass Difference | Body Fat % Difference |
|---|---|---|
| Prodigy ↔ iDXA | 0.10–0.40 lbs | 0.10–0.30 pts |
| Within Prodigy family | 0.80–2.10 lbs | 0.75–0.95 pts |
Comparisons involving the iDXA came in under half a pound of lean mass. Within the Prodigy family—across sub-models, across cities—the widest gap stayed around 2 lbs, well within normal day-to-day hydration fluctuation.
Published DEXA precision studies report a coefficient of variation of 0.5–1% for total body lean mass on back-to-back scans with repositioning (Rothney et al., 2012; Hind et al., 2011). Watson et al. (2017) found similar agreement comparing GE Lunar iDXA and Prodigy systems directly. Our cross-location, cross-machine data falls within that range. The variation between GE systems at different DexaFit locations is comparable to what you'd see scanning twice on the same machine.
The more useful part is what stayed the same.
Your body carries a compositional fingerprint—a specific pattern of how lean mass and fat mass distribute across your trunk, arms, and legs. This signature travels with you across GE systems with near-perfect fidelity:
| Distribution Ratio | Correlation Across Machines |
|---|---|
| Lean-to-fat ratio | r = 0.98 |
| Trunk fat distribution | r = 0.94 |
A correlation of 0.98 is about as close to perfect agreement as real-world measurement gets. The signature that matters most for clinical interpretation—where you carry lean mass and fat, and in what proportion—is preserved across locations.
Same Body, Different Lens
Two DEXA scanners give slightly different readings on the same person. Why?
Imagine you make a fruit smoothie—banana, yogurt, ice, blended together—and you want to know exactly how much of each ingredient is in the cup without opening it. Two companies each build a device to figure that out. Both shine a light through the cup and analyze what comes back. Both use real physics. Both are precise. But they use slightly different light frequencies, different sensors, different formulas to interpret the signal. One estimates 32% banana. The other says 29%. The smoothie didn't change. The estimation method did.
That's what DEXA does with your body. The scanner passes a very low dose of energy through you and measures how different tissues—bone, lean mass, fat—absorb that energy at different rates. The math that translates those absorption patterns into body composition numbers is where the engineering choices live. Two scanners from the same manufacturer, using the same math, produce nearly identical results. Two scanners from different manufacturers, using different math, produce results that are each internally consistent but don't perfectly align with each other.
Within the GE ecosystem—Prodigy and iDXA—the scanners share enough calibration architecture that they function like the same estimation device with minor hardware variations. The numbers line up. That's why a scan at DexaFit Dallas and a scan at DexaFit Seattle, both on GE systems, agree within the precision range of a single machine.
The Manufacturer Boundary
Crossing from GE to Hologic produces a 4x larger discrepancy in lean mass readings. This is a reference frame shift—not a change in your body.
Where the numbers shift—predictably and for well-understood reasons—is when you cross from one manufacturer's ecosystem to the other.
When the same person scans on a GE system and a Hologic system within 30 days:
| Metric | Within GE | GE ↔ Hologic |
|---|---|---|
| Lean mass difference | ~1.8 lbs median | ~7.8 lbs median |
| Body fat % difference | ~0.7 points median | ~3.1 points median |

A 4x increase when crossing manufacturer lines. And across our mix of GE and Hologic model pairs, the direction isn't consistent—sometimes GE reads higher lean mass, sometimes lower. The magnitude varies by individual. No simple correction factor works.
We tested this. Global offsets, body-fat-stratified adjustments, location-specific calibrations, linear regressions validated with leave-one-out cross-validation. The best correction achieved a 0.3% improvement. Most made things worse. Recent standardization studies show that while group-level cross-calibration equations can reduce systematic bias, individual-level variability in cross-manufacturer offsets remains substantial (Vendrami et al., 2024; Reitshamer et al., 2021).
Photograph the same person, seconds apart, with two different camera models. The scene hasn't changed. The person hasn't moved. But each camera carries different optics, a different sensor, different image-processing software. One photo comes out warmer. The other cooler. Neither is wrong. They're two faithful renderings of the same moment through different engineering.
DEXA works the same way. Both GE and Hologic pass very low dose energy through the body and use the attenuation patterns to calculate bone mineral content, lean mass, and fat mass. But the specific engineering diverged decades ago and, despite ongoing standardization efforts, has not fully converged (Shepherd et al., 2017; Shepherd et al., 2012).
GE Healthcare developed the Prodigy and iDXA lines in Madison, Wisconsin—narrow fan-beam design, cerium filter, tissue decomposition algorithms refined over 35 years of independent R&D. Hologic developed the Discovery and Horizon lines in Massachusetts—different fan-beam geometry, different pulse-switching method, algorithms evolved on a completely separate track. Both FDA-cleared. Both clinically validated. Both precise. But not interchangeable.
Four specific sources drive the difference:
-
1Different calibration references. Each manufacturer calibrates against proprietary phantoms with different compositions. "Zero" is defined differently (Shepherd et al., 2017).
-
2Different tissue decomposition algorithms. The trunk is where bone, organs, lean tissue, and fat all overlap, making tissue decomposition particularly challenging—and each system uses different mathematical models to untangle those signals (Toombs et al., 2012).
-
3Different reference populations. Bone density T-scores compare you to a "young healthy adult" reference. GE and Hologic built their reference populations from different source databases. GE T-scores may run approximately 0.5–0.7 points higher for total body BMD on the same person (Jankowski et al., 2019; Park et al., 2021).
-
4Different beam geometries. Different fan-beam geometries and detector arrays interact differently with body geometry—magnification correction, scatter correction, edge detection all differ (Shepherd et al., 2017).
Dead Reckoning
In dead reckoning navigation, a ship estimates its position by tracking speed and direction from a known starting point. Precise over short distances. But every estimate carries a small margin of error, and those errors compound. The British Admiralty called it the "expanding pool of errors"—the farther you travel from your last verified fix, the wider the uncertainty grows.
Within a single manufacturer's ecosystem, each DEXA scan is a fresh fix. The instruments share the same reference frame, so the errors stay small. Cross from GE to Hologic and the reference frame changes. You haven't moved. The chart did.
That's why the first scan on a new manufacturer's system functions as a new baseline. Not because the old data is invalid—because the reference frame shifted. You start a new trendline, but the data going forward is just as precise as before.
The Measurement Chain
DexaFit controls every variable in the measurement chain—permanent installation, daily calibration, standardized positioning—leaving only the physics itself as the source of variation.
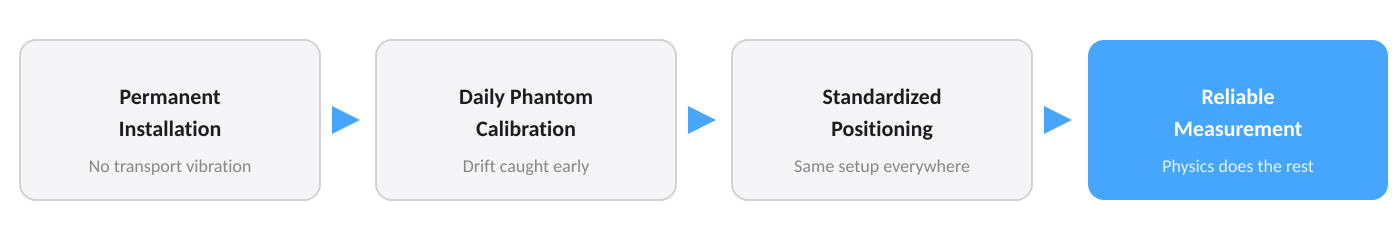
The consistency we see across GE systems at different DexaFit locations isn't accidental. The precision of any DEXA scan depends on the entire measurement chain—not just the scanner, but everything surrounding it.
Every DexaFit scanner is permanently installed. Never subjected to road vibration or the mechanical stress of transport, which can increase the risk of calibration shifts over time.
Every location runs a daily phantom calibration—a check against a manufacturer-specified reference standard every day the scanner operates. Drift gets caught before it accumulates.
Every location follows standardized positioning protocols. Patient positioning is one of the largest sources of technician-dependent variability in DEXA scanning. Hand placement alone can shift regional body composition results by clinically meaningful amounts (Thurlow et al., 2018). A scan in Dallas and a scan in Seattle start from the same physical setup.
Not every DEXA provider controls for all of these variables. When the major controllable sources of variability are addressed—equipment stability, calibration consistency, patient positioning—the remaining variation comes down to the physics of the measurement itself. And the physics, as the data shows, is remarkably consistent.
The Playbook
A good rule of thumb: if you're scanning at a different DexaFit location but staying within the same manufacturer's system, your data carries over. Our within-GE results tell the story—the agreement is strong enough that your trends remain legible across locations. If the comparison involves an iDXA, the agreement gets even tighter.
Switching between GE scanner models—say, Prodigy at one location and iDXA at another? Still solid. The GE ecosystem behaves as a single coherent system for body composition tracking purposes. Cross-model comparisons consistently land within published single-machine precision.
The thing to watch for is the manufacturer boundary. Crossing from GE to Hologic, or vice versa—that's where you treat the first scan on the new system as a fresh baseline. Note the system change in your tracking history. Your body didn't change. The reference frame did. Your trends from the new baseline forward will be just as precise as before.

The Signal
A four-pound gain in lean mass over six months—real, earned biological adaptation—shows up unmistakably on any GE system. It stands well above the noise floor. A shift in where you carry that mass—more in your trunk, less in your limbs, or the reverse—shows up too, with the same clarity. That's the resolution that matters. Not whether two scanners agree to the tenth of a pound, but whether the instrument sees change when change actually happened.
Measurements that can be gamed eventually get gamed. Goodhart's Law in practice. Proof-of-work metrics resist this because the number reflects real biological change or it doesn't move at all. DEXA's authority comes from the same place: the number can't be shortcut, and within a manufacturer's ecosystem, it can't be confused by instrument variation. The signal is still easy to read.
Your compositional fingerprint—that specific pattern of how your body distributes lean mass and fat—is preserved across every GE scanner in the DexaFit network with correlations as high as 0.98. What matters is whether the trend reads clearly. Within the same manufacturer, it does.
If you've ever noticed a number shift when scanning at a new location, now you have the framework to read it. Same body. Same progress. Different lens.
References
- Albano, D., et al. (2021). Operator-related errors and pitfalls in dual energy X-ray absorptiometry. Academic Radiology, 28(9), 1272–1286. DOI: 10.1016/j.acra.2020.07.028
- Hind, K., Oldroyd, B., & Truscott, J.G. (2011). In vivo precision of the GE Lunar iDXA densitometer. European Journal of Clinical Nutrition, 65(1), 140–142. DOI: 10.1038/ejcn.2010.190
- Park, S.S., et al. (2021). Comparison of two DXA systems, Hologic Horizon W and GE Lunar Prodigy. Endocrinology and Metabolism, 36(6), 1219–1231. DOI: 10.3803/EnM.2021.1274
- Reitshamer, E., et al. (2021). Cross-calibration of Prodigy and Horizon A densitometers. Journal of Clinical Densitometry, 24(3), 474–480. DOI: 10.1016/j.jocd.2021.02.003
- Rothney, M.P., et al. (2012). Precision of GE Lunar iDXA for total and regional body composition. Journal of Clinical Densitometry, 15(4), 399–404. DOI: 10.1016/j.jocd.2012.02.009
- Shepherd, J.A., et al. (2012). Universal standardization of whole-body bone density and composition. Journal of Bone and Mineral Research, 27(10), 2208–2216. DOI: 10.1002/jbmr.1654
- Shepherd, J.A., et al. (2017). Body composition by DXA. Bone, 104, 101–105. DOI: 10.1016/j.bone.2017.06.010
- Jankowski, L.G., et al. (2019). Cross-calibration, least significant change, and quality assurance: 2019 ISCD Official Position. Journal of Clinical Densitometry, 22(4), 472–483. DOI: 10.1016/j.jocd.2019.09.001
- Thurlow, S., Oldroyd, B., & Hind, K. (2018). Effect of hand positioning on DXA parameters. Journal of Clinical Densitometry, 21(3), 375–382. DOI: 10.1016/j.jocd.2017.03.003
- Toombs, R.J., et al. (2012). Impact of recent technological advances on DXA trueness and precision. Obesity, 20(1), 30–39. DOI: 10.1038/oby.2011.211
- Vendrami, C., et al. (2024). Standardization of body composition parameters between GE Lunar iDXA and Hologic Horizon A. JBMR Plus, 8(9), ziae088. DOI: 10.1093/jbmrpl/ziae088
- Watson, L.P.E., Venables, M.C., & Murgatroyd, P.R. (2017). Differences in bone density and body composition between 2 GE Lunar densitometers. Journal of Clinical Densitometry, 20(4), 498–506. DOI: 10.1016/j.jocd.2017.06.029
